Chatbot ROI metrics show whether customer conversations are generating qualified leads, influenced revenue, faster responses and measurable support savings. This guide explains seven chatbot KPIs founders can track, how to calculate each metric and how to use the results in a weekly performance dashboard.
Why chatbot ROI metrics matter for revenue and efficiency
- Use two financial views – Report both net chatbot value and chatbot ROI percentage. Net value shows the dollars created or saved, while ROI percentage makes it easier to compare the chatbot investment with other growth and support initiatives.
- Missed leads hurt – Slow replies and after-hours gaps cause leaks in the funnel that compound every week, especially for demo-driven businesses and ecommerce checkouts (ref: Zendesk ). A 24 by 7 chatbot covers nights and weekends so prospects are not lost to competitors. It also lets you set a reliable first-response SLA regardless of agent staffing. That means better customer experience and more completed conversations.
- Keep the scorecard focused – A compact set of chatbot KPIs makes it easier to review revenue, conversion, response speed, support deflection and escalation without burying decisions under vanity metrics. Use the same definitions and reporting window each week so changes reflect actual performance rather than inconsistent measurement.
- Shopify, WhatsApp, and SMS matter – Founders should unify web, Shopify, WhatsApp, and SMS chat metrics so the business sees channel lift instead of siloed activity (ref: Financial Models Lab ). A single view prevents channel cannibalization from hiding real gains. It also ensures your follow-up sequences are consistent. Multilingual bots can then scale to new markets.
The 7 chatbot ROI metrics every founder should track
- Standout stat: 7 core metrics – These 7 metrics cover the full funnel from first chat to cash and support savings so you can attribute revenue and efficiency gains without guesswork (ref: AI2ROI ). Each metric can be segmented by channel, campaign, language, and intent. That gives you clarity on what to scale and what to fix. Use the sample queries below to pull each metric on demand.
1) Chat-to-lead conversion rate
- What it proves – This shows how many chats become qualified leads such as form fills, bookings, quotes, or checkout starts. If this number rises, your chatbot is turning anonymous traffic into owned demand. It is the first metric to review when measuring lead-capture and qualification flows across website, SMS and WhatsApp.
- Formula – Chat-assisted revenue = the total attributed revenue from orders or deals involving users who interacted with the chatbot within a defined lookback window. Use the same attribution model and 7- or 30-day lookback period each reporting cycle to prevent inconsistent or duplicated revenue reporting.
- Sample query – How many chat sessions on Shopify generated a form fill, checkout start, or demo request this week? Filter by campaign and UTM source. Compare new visitors versus returning. Break out mobile versus desktop to tune prompts (ref: Founders Network ).
2) Chat-assisted revenue
- What it proves – This tracks revenue tied to users who chatted before purchasing, whether the bot closed the sale or primed the buyer. It is the clearest founder metric because it connects conversations to orders and pipeline. Attribute by last-touch or multi-touch depending on your analytics maturity. Keep the model consistent to avoid over-counting (ref: ThoughtSpot ).
- Formula – Chat-assisted revenue = count of orders or deals influenced by chat multiplied by revenue per order or deal. Pull cohorts for users who chatted within a lookback window, such as 7 or 30 days. Use the same window for A by B tests so comparisons are clean. This metric should inform budget allocation for chat improvements (ref: Visible ).
- Sample query – What revenue came from customers who chatted with the bot before purchasing in the last 30 days? Group by bot flow and product category. Compare campaign entry points like paid search and email. Flag any high-revenue flow for expansion (ref: Findash ).
3) Lead response time
To improve this metric, review these chatbot flows for reducing response time across website, SMS and WhatsApp.
- What it proves – Speed wins, especially after hours. This metric tracks time from first inbound message to first helpful response. Chatbots should beat human queues and keep SLAs consistent at night and on weekends. Faster first responses correlate with higher completion and lower abandonment in CX programs (ref: Zendesk ).
- Formula – Lead response time = time of first response minus time of first inbound message. Report medians to avoid outliers. Break out after-hours separately to prove the 24 by 7 advantage. Track SLA compliance as a percent of chats answered inside your target window (ref: AI2ROI ).
- Sample query – How much faster did the chatbot respond than the human team during nights and weekends? Compare median seconds between first message and first helpful reply. Add a trend line week over week. Tie any big improvement to campaign launches or model upgrades (ref: ThoughtSpot ).
4) Support deflection rate
Founders can also use these AI chatbot cost-reduction strategies to translate deflected conversations into estimated labor and operating savings.
- What it proves – Deflection shows how many support issues the bot resolves without a human. This reduces ticket volume and labor hours while keeping response times quick. Track by issue type and language to find documents or macros to improve. High deflection with high satisfaction is the ideal combo for support leaders (ref: Zendesk ).
- Formula – Support deflection rate = resolved by bot without agent handoff divided by total support chats, multiplied by 100. Use a strict definition of resolved, such as confirmed answer with the user exiting or rating the solution. Avoid counting abandonments as resolved. This keeps your savings estimate honest (ref: ThoughtSpot ).
- Sample query – Which top 10 FAQ topics are fully resolved by the bot without escalation? Rank by volume and resolution rate. Surface the worst performers for training. Translate high-performing FAQs to extend wins globally (ref: Financial Models Lab ).
5) Escalation rate to human agent
- What it proves – Escalation rate reveals failure points where the bot needs help, such as missing content or unclear intents. It complements deflection so you see both sides of resolution. If escalation spikes on a topic, create new flows or docs. Reducing unnecessary escalations lowers costs while keeping CX thresholds intact (ref: AI2ROI ).
- Formula – Escalation rate = chats handed to humans divided by total chats, multiplied by 100. Visualize by sentiment and language to spot friction pockets. Segment by entry point, such as product page widget versus order portal. These slices guide your next training pass (ref: ThoughtSpot ).
- Sample query – Where is the bot escalating most often, and which knowledge gaps cause it? Check transcripts for phrases like can you connect me or agent please. Tag gaps as policy, pricing, or returns. Prioritize fixes by volume and impact (ref: Zendesk ).
6) Order lift from chat
- What it proves – For ecommerce, the strongest proof of value is incremental behavior. Compare users exposed to chat with a randomized bot-off control group whenever possible. If randomization is unavailable, use a carefully matched non-chat cohort and account for differences in traffic source, device, product page and purchase intent. This provides a more credible estimate of the chatbot’s incremental contribution than a basic chat-user versus non-chat-user comparison.
- Formula – Absolute order lift in percentage points = chat-exposed conversion rate − control-group conversion rate. Relative order lift (%) = [(chat-exposed conversion rate − control-group conversion rate) ÷ control-group conversion rate] × 100. Report average order value lift separately so conversion and order-value effects remain clear.
For Shopify-specific implementation, review how Noem.ai’s Shopify AI agents connect product assistance, support and checkout actions. - Sample query – Did shoppers who used the WhatsApp bot convert at a higher rate than shoppers who never chatted? Break down by campaign and geography. Test short versus long scripts for each market. Roll out the winner to high-traffic pages first (ref: Visible ).
7) Revenue per conversation
- What it proves – This normalizes performance across traffic volume so you can compare channels, languages, and campaigns head to head. It is a powerful efficiency number for founders because it blends sales and support impact into one rate. Use it to rank experiments and budget allocation. Higher revenue per conversation means your flows are efficient and scalable (ref: AI2ROI ).
- Formula – Revenue per conversation = chat-assisted revenue divided by total conversations. Track by bot, campaign, and language. Watch this weekly to prove compounding gains from better prompts and training. It is also easy to explain to boards and investors (ref: Findash ).
- Sample query – What is revenue per conversation for multilingual support chats compared with English-only chats? Segment by region and device. Tie any big gaps to localized content quality. Expand the best-performing language pairs first (ref: Financial Models Lab ).
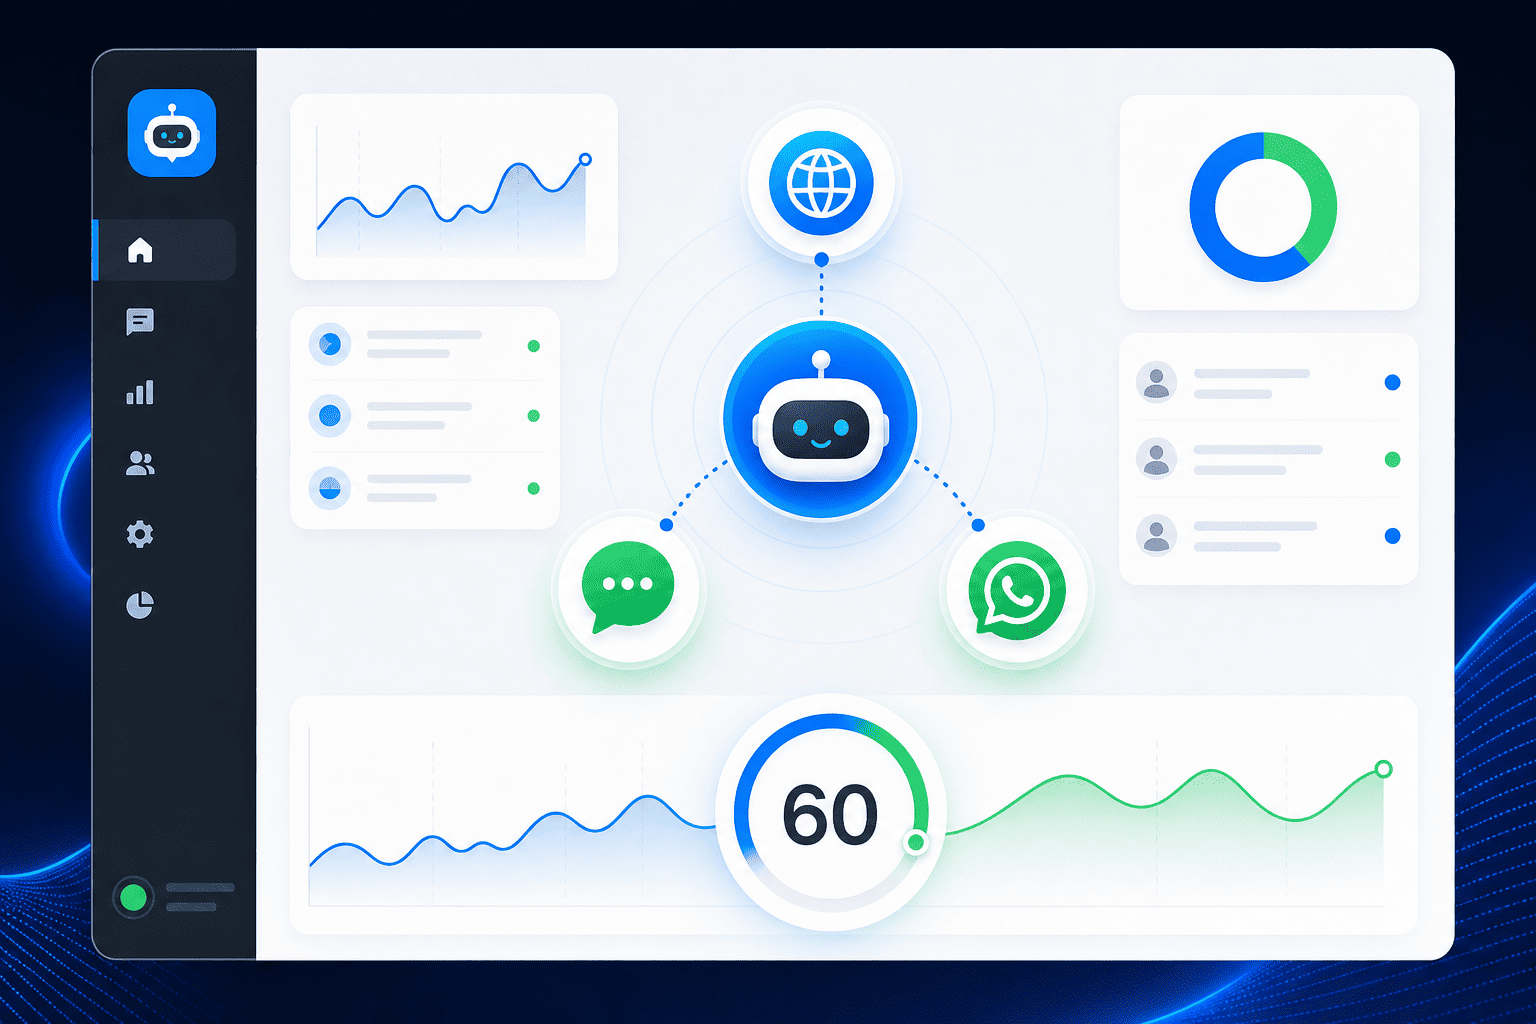
What a chatbot ROI dashboard should show at a glance
- Standout stat: 7 CX levers – A compact dashboard that centers on 7 levers helps leaders see impact fast: conversations started, leads captured, orders influenced, revenue, response speed, deflection, and escalation (ref: Zendesk ). These tiles answer where value comes from and where it is stuck. With filters for channel and language, teams can fix the highest-impact flows first. The goal is decisions in minutes, not hours.
- Core questions to answer – Your dashboard should answer four questions: how many conversations started, how many became leads or orders, how much revenue ties to those chats, and how much support work the bot saved. If a chart does not help answer one of these, it probably does not belong. Keep the top of the page free of vanity counts. The right tiles guide weekly experiments and roadmap focus (ref: ThoughtSpot ).
Sample dashboard layout you can copy
- Standout stat: 3 outcome pillars – Map tiles to revenue, adoption, and efficiency so finance, growth, and support leaders all see their number first on the page (ref: ThoughtSpot ). This shared view shortens meetings and aligns budgets. It reduces debate about which metrics matter. Everyone sees the same scoreboard.
- Top row – Total chats, qualified leads, chat-assisted revenue, and support deflection rate. These tell you if volume is healthy, the bot is capturing demand, sales are flowing, and support savings are real. Place them above the fold for instant context. Add 7 or 30 day comparisons to spot deltas quickly (ref: AI2ROI ).
- Middle row – Lead response time, escalation rate, order lift, and revenue per conversation. This row shows quality and efficiency. If response time slows or escalations spike, fix routing or content first. Use order lift and revenue per conversation to prioritize growth experiments (ref: Financial Models Lab ).
- Filters – Channel such as website, Shopify, WhatsApp, and SMS. Language such as English, Spanish, and French. Intent such as sales, support, returns, and billing. Time windows by hour, day, and campaign so teams can drill down fast without asking an analyst (ref: Visible ).
Chatbot KPI formulas for your dashboard
- Standout stat: 3 to 1 rule – A common startup benchmark is LTV at least 3 to 1 relative to CAC, which you can extend to chat programs by showing that chat raises LTV or lowers CAC through self-serve resolution and higher conversion (ref: Visible ). Framing formulas this way keeps teams focused on value creation. It also makes budget asks easier. Finance will see exactly where ROI comes from.
- Chat-to-lead conversion rate – Qualified leads from chat divided by total chats, then multiplied by 100. Add a definition of qualified such as booked demo or both email and phone captured. Use the same definition across channels. This reduces noisy swings and aids week over week comparisons (ref: AI2ROI ).
- Chat-assisted revenue – Count of influenced orders or deals multiplied by revenue per order or deal. Use a 7 or 30 day lookback window applied consistently. Attribute by last-touch or data-driven if available. Consistency beats complexity for board reporting (ref: ThoughtSpot ).
- Lead response time – Time of first helpful response minus time of first inbound message. Report median and 90th percentile. Split business hours versus after hours to show 24 by 7 coverage gains. Tie SLAs to target thresholds your team can meet (ref: Zendesk ).
- Support deflection rate – Resolved by bot without agent handoff divided by total support chats, multiplied by 100. Confirm resolution using explicit user feedback or successful outcome completion. Do not treat abandonment as resolution. That would inflate savings (ref: Financial Models Lab ).
- Escalation rate – Chats handed to humans divided by total chats, multiplied by 100. Track by topic, language, and entry point. Use transcript reviews to map common failure patterns. Fix the highest-volume gaps first for quick wins (ref: AI2ROI ).
- Order lift from chat – Conversion rate of chat users minus conversion rate of non-chat users. Keep cohorts clean by excluding support-only interactions. Add AOV lift as a companion metric. Together they tell a clear revenue story (ref: ThoughtSpot ).
- Revenue per conversation – Chat-assisted revenue divided by total conversations. Rank by campaign and language to prioritize scale decisions. Share this tile in board updates. It is simple, comparable, and hard to dispute (ref: Findash ).
Rapid A by B checks founders can run this week
- Standout stat: 6 core startup KPIs – Tie every A by B to core KPIs like conversion, CAC, LTV, and retention so experiments map to the numbers investors expect to see (ref: Visible ). This keeps your roadmap aligned with growth. It also avoids tests that generate activity without impact. Every variant should have a clear success measure.
- Bot on vs bot off – Run an A by B where a high-traffic page has the bot while a matched page does not. Measure conversion rate, response time, and chat-to-lead conversion. If the bot wins, expand to other pages. Keep exposure windows equal for clean reads (ref: Founders Network ).
- Human-first vs bot-first routing – Test whether the bot greets first or offers quick human handoff. Track escalation rate and abandonment. A win looks like lower abandonment with equal or better lead capture. Use transcripts to refine routing rules (ref: Zendesk ).
- Short script vs long script – Compare a concise qualification flow to a more detailed one. Measure completion rate, chat-to-lead conversion, and escalation. Shorter often reduces friction, but product complexity can flip the result. Let the data choose the winner (ref: AI2ROI ).
- English-only vs multilingual support – For global stores, test if localized chat increases engagement and conversion. Track conversation completion and revenue per conversation by region. Prioritize languages with the biggest lift. Multilingual support compounds value as you scale (ref: Financial Models Lab ).
- WhatsApp or SMS follow-up vs email only – Compare re-engagement for cart recovery and demo reminders. Track reply rate and recovered revenue. Messaging channels can outperform inbox-based follow-ups where read rates lag. Let cohort-level revenue decide allocation (ref: Visible ).
Sample weekly operating cadence
- Standout stat: 5 to 7 core metrics – High-functioning teams review 5 to 7 core metrics weekly so everyone sees leading indicators and can act fast, instead of drowning in dozens of charts (ref: Founders Network ). This cadence keeps experiments tightly coupled to outcomes. It also builds a habit of rapid iteration. The result is faster compounding wins.
- Monday – scoreboard and blockers – Start with the dashboard and a 15-minute review of deltas in conversion, response time, and deflection. Flag any anomalies and assign owners. Keep a single doc of issues and fixes so learnings compound. End with two prioritized experiments for the week (ref: Visible ).
- Midweek – transcript dives – Read a random sample of transcripts for the topics with the worst escalation rates. Tag gaps as pricing, policy, or product details. Update prompts or knowledge where needed. Push lightweight changes without waiting for a full sprint (ref: Zendesk ).
- Friday – experiment reads – Close the loop on A by B tests with a single-chart readout per experiment. If there is a clear winner, scale it to the next highest-traffic surface. If inconclusive, refine and rerun. Archive results in a shared hub for future context (ref: ThoughtSpot ).
Useful benchmark context for founders
- Standout stat: 3 to 1 LTV to CAC – Many startup playbooks recommend LTV at least 3 to 1 relative to CAC. Chatbots can support that by increasing conversion and retention while reducing support cost per resolution (ref: Visible ). Benchmarks guide targets but do not replace experiments. Use them to set guardrails and celebrate wins. Keep improving the scoreboard.
- Metric families – Startup metric guides repeatedly highlight revenue, CAC, LTV, conversion, and engagement as the backbone. For chat programs, prove impact by moving at least one of those every quarter. If a metric does not move, change the flow. Keep experiments focused on one outcome per test for clarity (ref: Founders Network ).
How to calculate chatbot ROI
- Standout stat: 1-line ROI – Use a one-line formula to explain chatbot value in any exec meeting: Chatbot ROI (%) = [(incremental chat-assisted revenue + support cost savings − total chatbot cost) ÷ total chatbot cost] × 100. You can also report net chatbot value separately: incremental chat-assisted revenue + support cost savings − total chatbot cost. Use the Noem.ai AI Concierge ROI Calculator to estimate potential revenue lift and support savings using your own business inputs. This framing aligns engineering, CX, and finance around the same math. It also makes tradeoffs clearer when budgets are tight. Keep the formula pinned to your dashboard.
Chatbot ROI metrics: key takeaways
- Chat-to-lead conversion rate measures how effectively conversations capture qualified demand.
- Chat-assisted revenue connects chatbot interactions with orders and sales pipeline.
- Lead response time measures speed and first-response SLA performance.
- Support deflection and escalation rates reveal efficiency and knowledge gaps.
- Order lift estimates the chatbot’s incremental ecommerce impact.
- Revenue per conversation compares efficiency across channels, campaigns and languages.
Frequently asked questions about chatbot ROI metrics
-
How do I calculate chatbot ROI?
Add incremental chat-assisted revenue and support cost savings, subtract the total cost of the chatbot, divide the result by the total chatbot cost and multiply by 100. Keep the same attribution window and cost assumptions each reporting period so the results remain comparable. - What is chat-assisted revenue and how do I track it?
Chat-assisted revenue is sales tied to users who chatted before purchase. Use a consistent 7 or 30 day lookback and attribute by last-touch or multi-touch. Report it by channel and campaign. - What is a good support deflection rate?
A good rate is one that rises without hurting satisfaction. Track resolution confirmation and avoid counting abandonments. Segment by issue type to find quick wins. - How do I calculate revenue per conversation?
Divide total chat-assisted revenue by total conversations in the same period. Compare by channel, language, and campaign to prioritize experiments and budget. - What should I A by B test first?
Start with bot on vs bot off on a high-traffic page. Measure conversion, response time, and revenue per conversation. Expand the winning setup. - How often should founders review chatbot metrics?
Review the 7 core metrics weekly. Use a short Monday scorecard, a midweek transcript check, and a Friday experiment readout to keep momentum.
Ready to measure the business impact of your chatbot? Choose one A/B test, track the seven chatbot ROI metrics above and use the Noem.ai ROI Calculator to estimate revenue lift and support savings before scaling the winning flow.